Chart story Sep 29 - Oct 3
NDX weekly trend
USD weekly trend - last time it took 3 tries to break out from down trend into a sideways trend
Gold weekly trend - remaining with 10MA all the way up
BTC weekly trend
USDJPY massive weekly H&S / rectangle
GBP monthly channel
WTIC monthly descending triangle false breakdown
BTC weekly ascending triangle
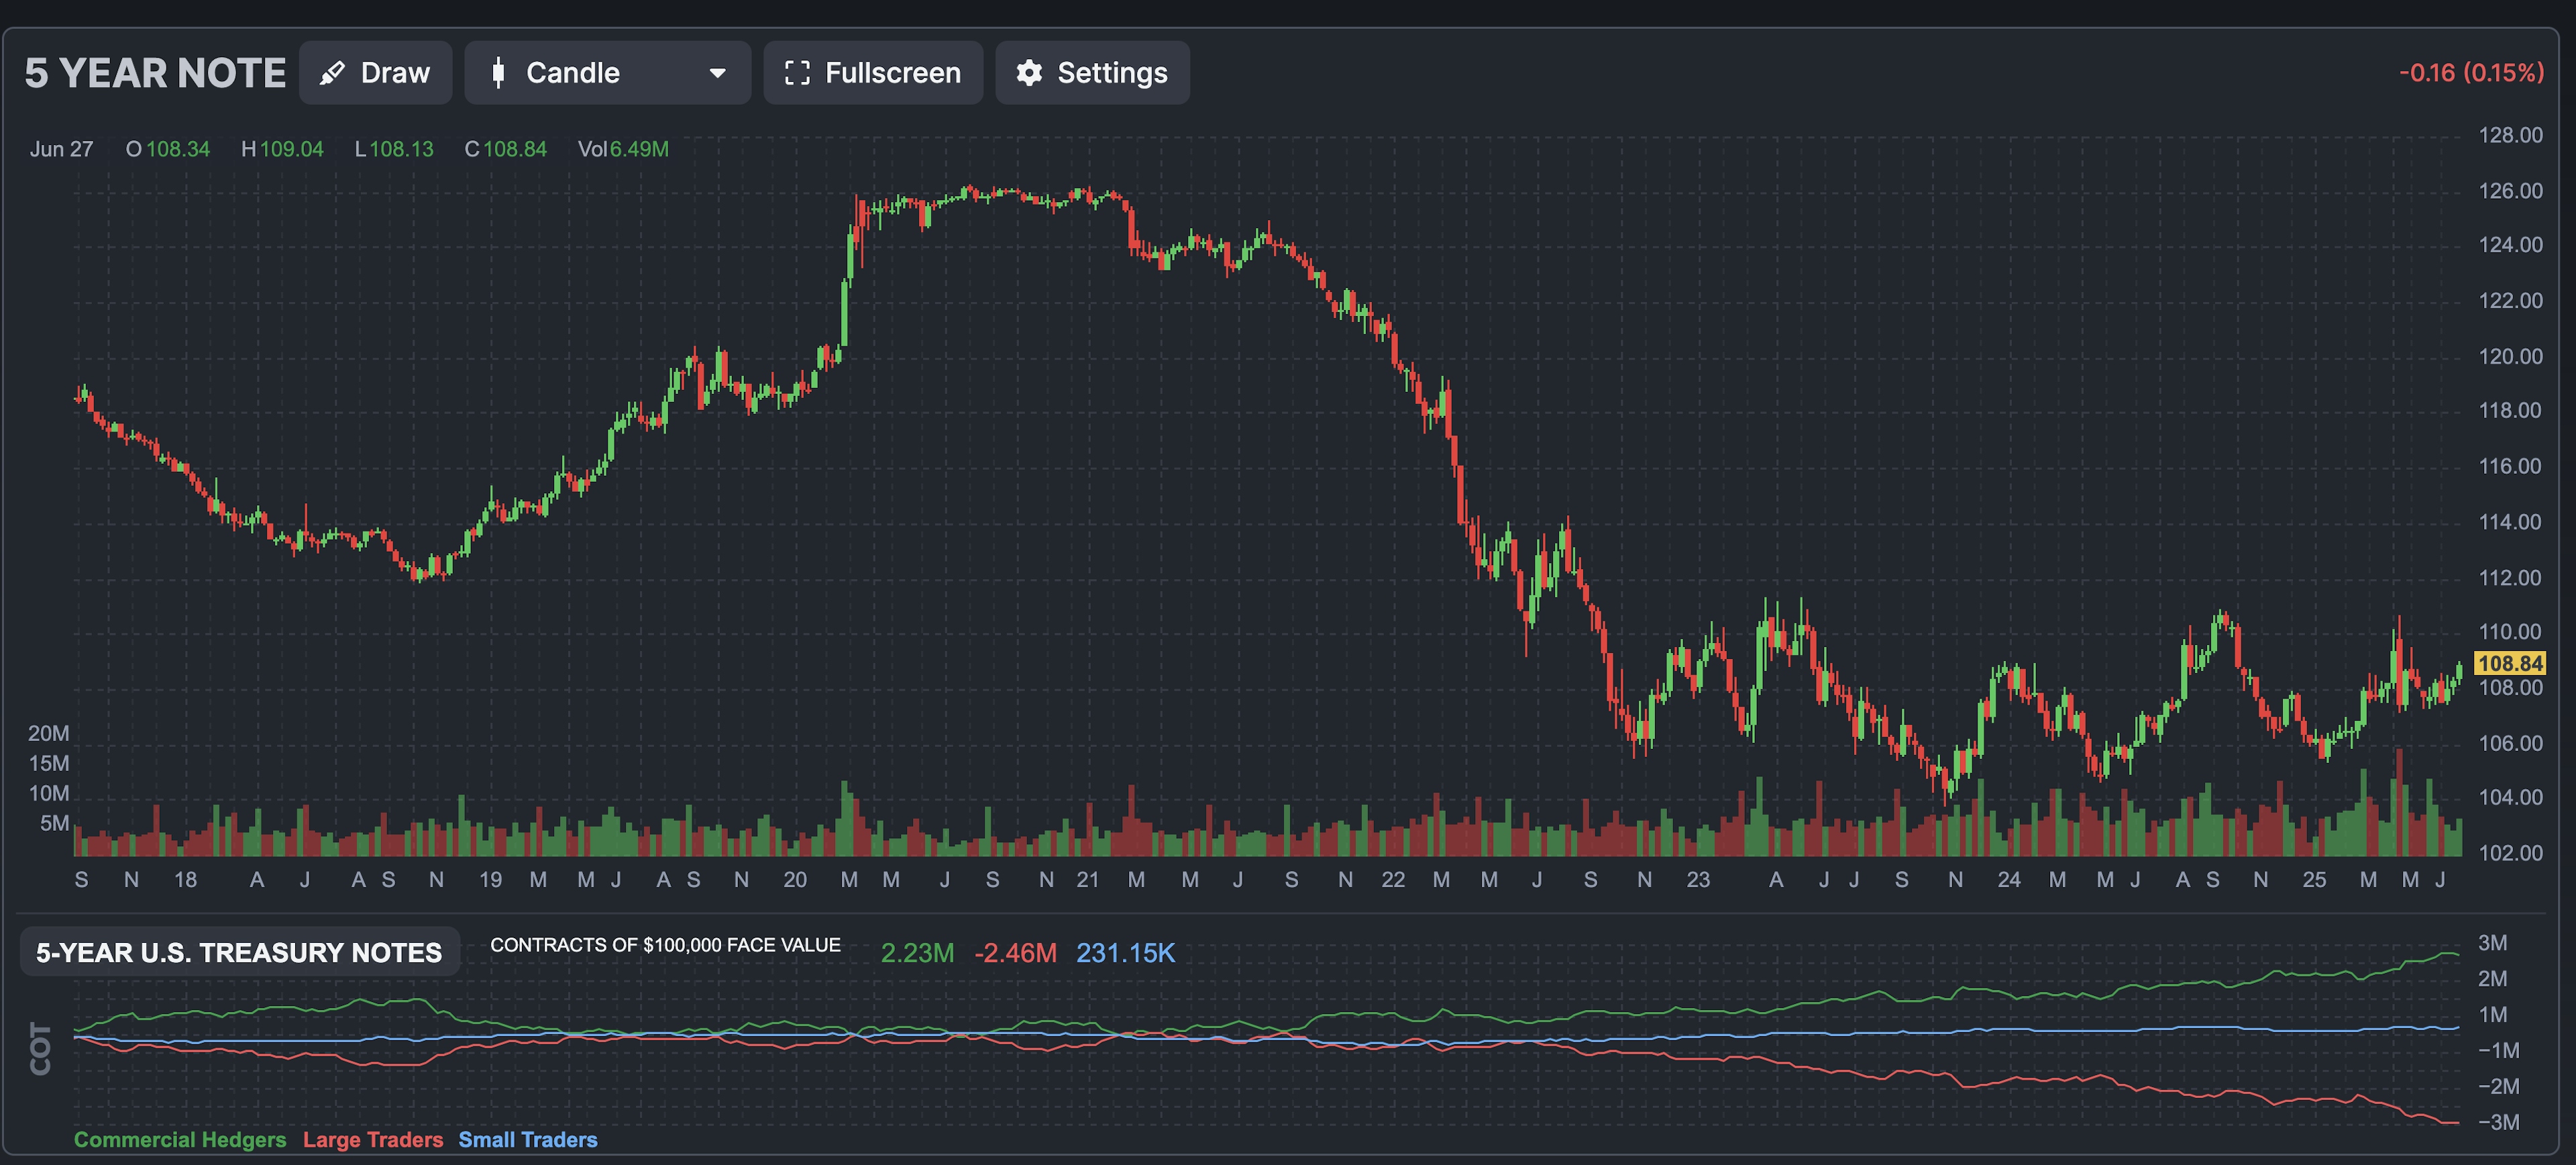
ZF COT bullish